


Australian Unit Market Update | November 2022
2022-11-30
Key takeaways
CoreLogic's national unit value index declined by 0.8% in October, with the median value of $598,417, -3.8% below the peak recorded in April. House values fell by 1.3% in October, with the annual growth trend for house values falling into negative territory.
As the downward phase of the cycle continues, unit values have been falling more widely, but the quarterly pace of decline has eased slightly. This may be due to the smaller increases in the official cash rate between October and November, and a lacklustre spring selling season.
Over the four weeks to October 30th, newly advertised unit listings were -14.6% below the previous five-year average, and total advertised supply was -8.1% below the average listings level for this time of year.
Regional SA's median unit value is the cheapest amongst the greater capitals and rest of state regions, at $239,856, while Adelaide's average unit value is $436,462.
The Brisbane unit market recorded its first quarterly decline in two years, with unit values falling -1.2% over the three months to October. Regional Queensland recorded a larger quarterly decline in unit values, with the strongest decline in unit values recorded in Regional Tasmania.
While the value of units across Australia's unit market is likely to continue to decline over the coming months, a few tailwinds are starting to emerge. The de-deceleration in the quarterly growth trend could be an indication that we have moved passed the worst value declines.
Continuing the trend seen over the past six months, CoreLogic's national unit value index declined by -0.8% in October, taking the median value to $598,417, -3.8% below the peak recorded in April.
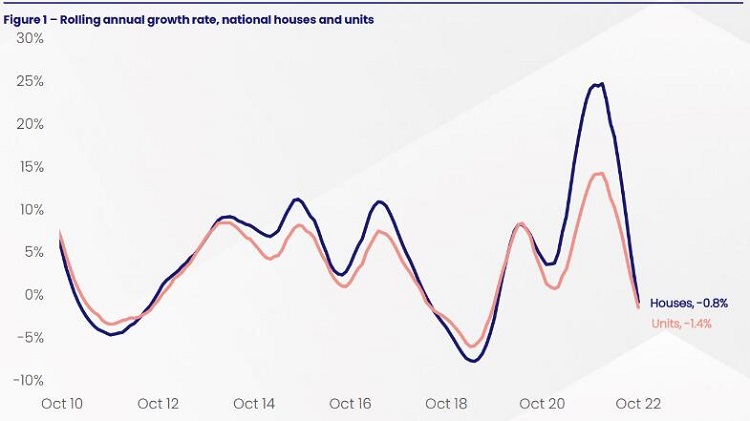
This saw the annual growth trend for national unit values fall into negative territory for the first time in almost three years, with unit values now -1.4% below the level recorded this time last year.
By comparison, national house values ($779,369) fell -1.3% over the month, taking house values -6.6% below the April peak and -0.8% lower over the 12 months to October.
House values continue to be more sensitive to rising interest rates compared to units
As the larger monthly increases in house values recorded over the final quarter of last year fall out of the annual calculation, we'll likely see the annual growth trends intersect before the performance gap between house and unit values inverts in favour of units.
As the downward phase of the cycle continues and falling values have become more widespread, the quarterly pace of decline has eased slightly.
Across the combined capitals, the quarterly change in unit values has eased from a -2.7% decline in the September quarter to - 2.4% over the three months to October.
Several factors may have helped influence this deceleration.
Not least the smaller increases in the official cash rate between October and November, as well as a lacklustre spring selling season.
On average the flow of freshly advertised capital city unit listings surges by approximately 37.1% each year between the end of winter and the spring peak in October.
However, in 2022, weaker selling conditions and lower vendor confidence saw the flow of fresh unit listings fell by -3.6% over the same period.
This has helped to keep the total advertised supply below the previous five-year average, despite a slowdown in buyer demand.
New and total advertised listings
Over the four weeks to October 30th, newly advertised unit listings across the combined capitals were -14.6% below the previous five-year average, while total advertised supply was -8.1% below the average listings level for this time of year, indicating vendors were not dumping unit stock or rushing to exit the market.
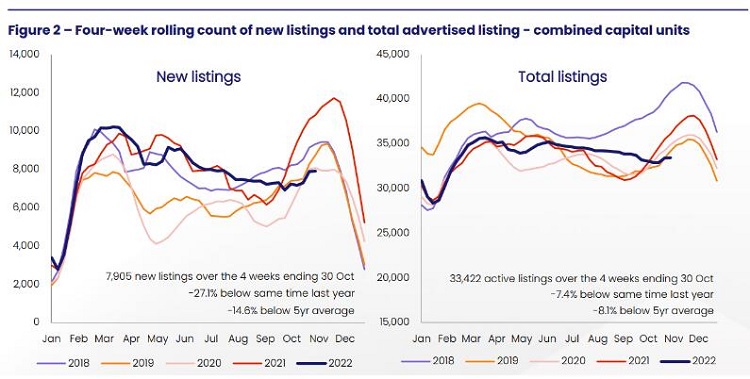
There has been no material increase in the number of distressed unit listings, in fact, total listings have remained fairly flat, with many prospective sellers choosing to wait for more favourable market conditions rather than sell during a downturn.
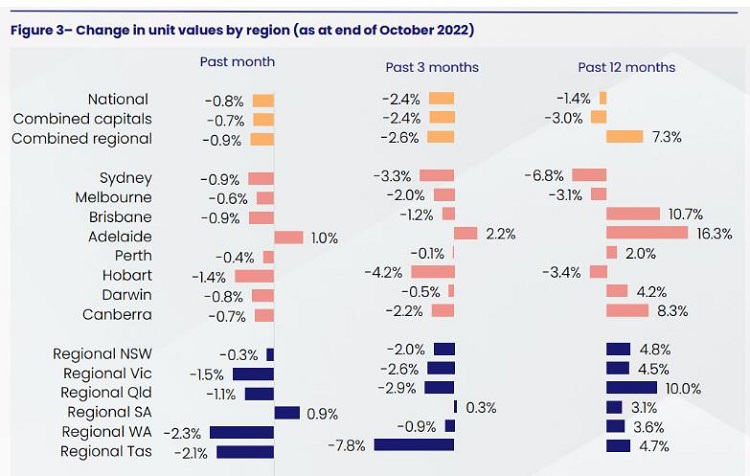
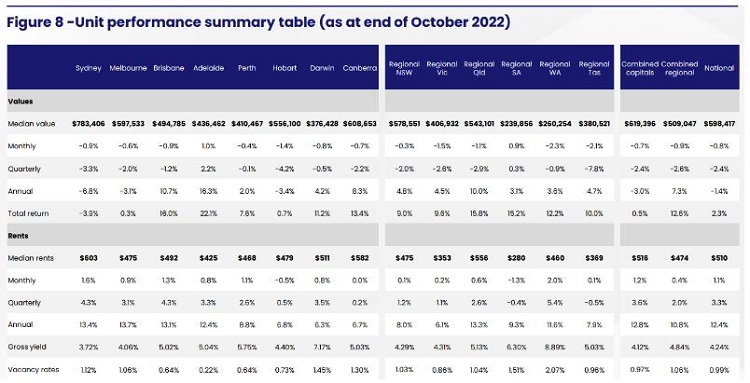
Unit values across Adelaide and Regional SA continue to be resilient to the current market conditions, recording monthly increases of 1.0% and 0.9%, respectively.
At $239,856, Regional SA's median unit value is the cheapest amongst the greater capitals and rest of state regions, while the average unit in Adelaide ($436,462) is more than $150,000 cheaper than Melbourne ($597,533 ) and almost $350,000 cheaper than Sydney ($783,406 ).
The current downturn has been fairly orderly so far
The current downturn has been fairly orderly so far, with declines first emerging in the most expensive markets before flowing through to the broad middle and more affordable markets.
Given their relative affordability and below-average listing levels, it's unsurprising that SA's unit values are still increasing.
However, the pace of growth across these markets has shown some signs of easing.
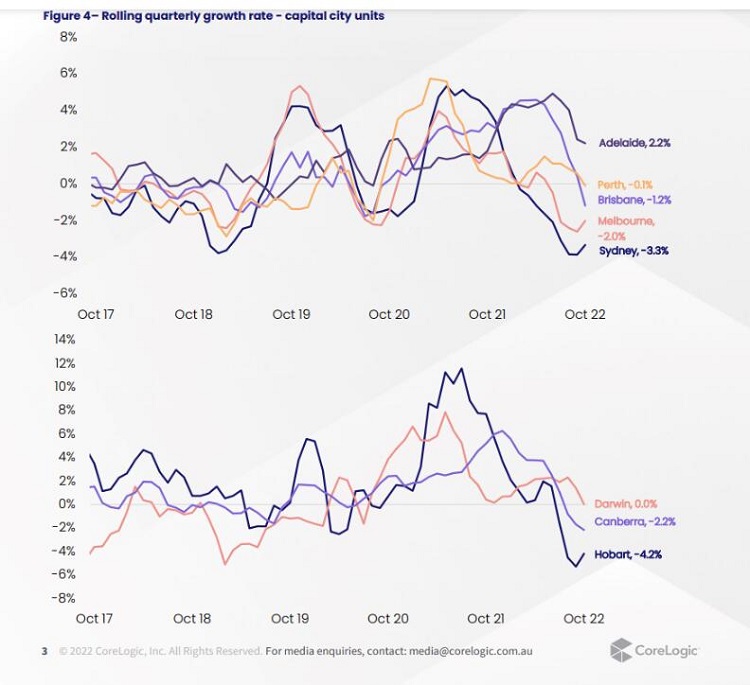
Other affordable unit markets, including Perth, Darwin, and Regional WA, recorded relatively mild value declines over the three months to October, down -0.1%, -0.5%, -0.9%, respectively.
Brisbane recorded its first quarterly decline in two years, with unit values falling -1.2% over the three months to October.
As the most affordable capital on the east coast, Brisbane's unit market had been more robust.
However, six consecutive rate hikes, worsening affordability, and an easing in the South East Queensland migration trend have weakened demand.
Regional Queensland recorded a larger quarterly decline in unit values (-2.9%) thanks to a stronger decline across the Gold and Sunshine Coasts (down -2.9% and -6.0%, respectively).
At the other end of the scale, Regional Tasmania units recorded the strongest decline in unit values, with the quarterly growth rate remaining steady at -7.8% for the second consecutive month.
This was followed by units across Hobart (-4.2%) and Sydney (-3.3%), which both recorded a deceleration in the quarterly rate of decline, down from -5.3% and -3.9%, respectively, over the three months to September.
National unit rental index remained steady
The monthly change in CoreLogic's national unit rental index remained steady, rising 1.1% for the third consecutive month.
While the pace of quarterly rental growth has eased slightly from 3.7% over the July quarter to 3.3% over the three months to October, national unit rents are still increasing at twice the rate of house rents (1.6%).
With the exception of Regional SA and Hobart, each capital city and the regional area saw unit rents rise at a faster pace than their lower-density counterpart.
With a median weekly rental value of $510, national unit rents continue to be approximately $50 per week cheaper compared to national house rents at $561.
However, with the rate of growth in unit rents outperforming that of houses over the past year, the gap between house and unit rents has narrowed by around $10.
As the affordability benefit that unit rents offer diminishes, it's possible we could see some rental demand shift back in favour of the lower-density sector.
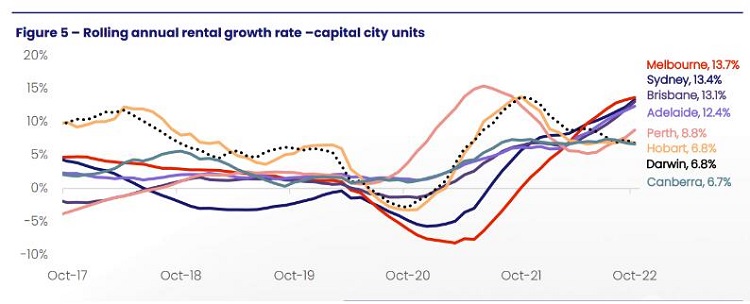
Across the individual capital city unit markets, the quarterly pace of rental growth across the capitals has continued to trend downwards.
The exception was Sydney, which recorded a new cyclical peak of 4.3% over8.89%the three months to October, thanks to the strong return of overseas migration.
Brisbane also recorded a 4.3% quarterly rise in rental values, down from 4.6% over the three months to September, while Darwin, Adelaide and Melbourne saw unit rents rise by 3.5%, 3.3% and 3.1%, respectively.
Hobart (0.5%) and Canberra (0.2%) recorded milder rental growth, due partially to the stronger growth trends seen over the beginning of COVID.
National gross rental yields for units rose a further nine basis points in October
National gross rental yields for units rose a further nine basis points in October to 4.24%, taking yields 58 basis points above the record lows recorded in December 2021 (3.66%).
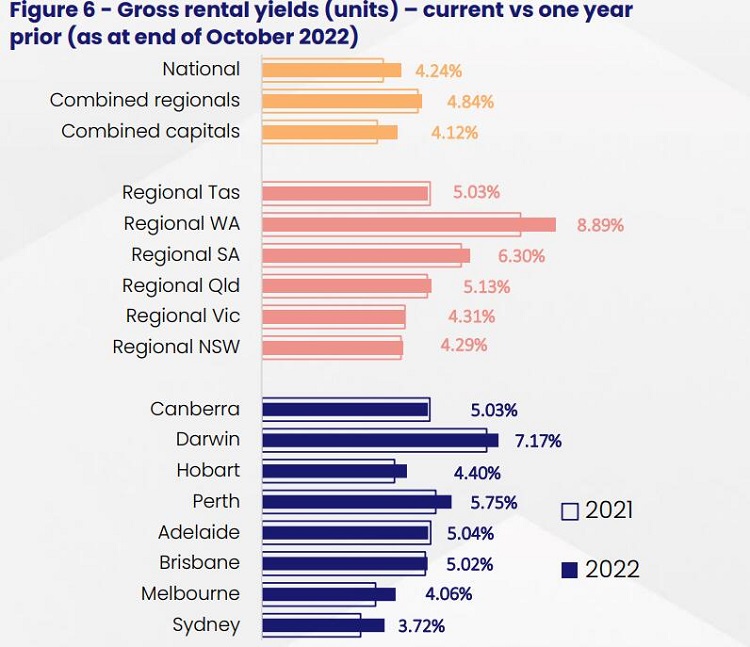
The strong yield recovery has seen each capital unit's yields rise above the levels recorded this time last year, with the exception of Adelaide and Canberra, where yields are still down eight and six basis points, respectively.
A few tailwinds are starting to emerge
While it is likely values across Australia's unit market will continue to decline over the coming months, a few tailwinds are starting to
emerge.
The de-deceleration in the quarterly growth trend could be an indication that we have moved passed the worst value declines.
However, it's still early days, and any change to the outlook for interest rates could see declines accelerate once more.
Additionally, Australia's labour market remains extremely tight, with the unemployment rate falling to 3.4% in October.
Coupled with the strong wage growth seen over the September quarter, this should help keep a lid on distressed or forced sales.
On the flip side, the November rate rise (25 basis points) took the cumulative increase in the cash rate 275 basis points higher than the record lows seen over COVID (0.10%).
or those who purchased before October 2021, interest rates have now risen by more than the 2.5% serviceability buffer they were assessed under, while those who purchased after October 2021 will soon reach their serviceability buffer (3.0%).
Arguably, household budgets have already been stretched by persistently high non-discretionary inflation, and many may find it hard to accommodate higher mortgage repayments.
As more borrowers move into uncharted territory, we could see an increasing number of households find it harder to service their loans.
CoreLogic's national unit value index declined by 0.8% in October, with the median value of $598,417, -3.8% below the peak recorded in April. House values fell by 1.3% in October, with the annual growth trend for house values falling into negative territory.
As the downward phase of the cycle continues, unit values have been falling more widely, but the quarterly pace of decline has eased slightly. This may be due to the smaller increases in the official cash rate between October and November, and a lacklustre spring selling season.
Over the four weeks to October 30th, newly advertised unit listings were -14.6% below the previous five-year average, and total advertised supply was -8.1% below the average listings level for this time of year.
Regional SA's median unit value is the cheapest amongst the greater capitals and rest of state regions, at $239,856, while Adelaide's average unit value is $436,462.
The Brisbane unit market recorded its first quarterly decline in two years, with unit values falling -1.2% over the three months to October. Regional Queensland recorded a larger quarterly decline in unit values, with the strongest decline in unit values recorded in Regional Tasmania.
While the value of units across Australia's unit market is likely to continue to decline over the coming months, a few tailwinds are starting to emerge. The de-deceleration in the quarterly growth trend could be an indication that we have moved passed the worst value declines.
Continuing the trend seen over the past six months, CoreLogic's national unit value index declined by -0.8% in October, taking the median value to $598,417, -3.8% below the peak recorded in April.
This saw the annual growth trend for national unit values fall into negative territory for the first time in almost three years, with unit values now -1.4% below the level recorded this time last year.
By comparison, national house values ($779,369) fell -1.3% over the month, taking house values -6.6% below the April peak and -0.8% lower over the 12 months to October.
House values continue to be more sensitive to rising interest rates compared to units
As the larger monthly increases in house values recorded over the final quarter of last year fall out of the annual calculation, we'll likely see the annual growth trends intersect before the performance gap between house and unit values inverts in favour of units.
As the downward phase of the cycle continues and falling values have become more widespread, the quarterly pace of decline has eased slightly.
Across the combined capitals, the quarterly change in unit values has eased from a -2.7% decline in the September quarter to - 2.4% over the three months to October.
Several factors may have helped influence this deceleration.
Not least the smaller increases in the official cash rate between October and November, as well as a lacklustre spring selling season.
On average the flow of freshly advertised capital city unit listings surges by approximately 37.1% each year between the end of winter and the spring peak in October.
However, in 2022, weaker selling conditions and lower vendor confidence saw the flow of fresh unit listings fell by -3.6% over the same period.
This has helped to keep the total advertised supply below the previous five-year average, despite a slowdown in buyer demand.
New and total advertised listings
Over the four weeks to October 30th, newly advertised unit listings across the combined capitals were -14.6% below the previous five-year average, while total advertised supply was -8.1% below the average listings level for this time of year, indicating vendors were not dumping unit stock or rushing to exit the market.
There has been no material increase in the number of distressed unit listings, in fact, total listings have remained fairly flat, with many prospective sellers choosing to wait for more favourable market conditions rather than sell during a downturn.
Unit values across Adelaide and Regional SA continue to be resilient to the current market conditions, recording monthly increases of 1.0% and 0.9%, respectively.
At $239,856, Regional SA's median unit value is the cheapest amongst the greater capitals and rest of state regions, while the average unit in Adelaide ($436,462) is more than $150,000 cheaper than Melbourne ($597,533 ) and almost $350,000 cheaper than Sydney ($783,406 ).
The current downturn has been fairly orderly so far
The current downturn has been fairly orderly so far, with declines first emerging in the most expensive markets before flowing through to the broad middle and more affordable markets.
Given their relative affordability and below-average listing levels, it's unsurprising that SA's unit values are still increasing.
However, the pace of growth across these markets has shown some signs of easing.
Other affordable unit markets, including Perth, Darwin, and Regional WA, recorded relatively mild value declines over the three months to October, down -0.1%, -0.5%, -0.9%, respectively.
Brisbane recorded its first quarterly decline in two years, with unit values falling -1.2% over the three months to October.
As the most affordable capital on the east coast, Brisbane's unit market had been more robust.
However, six consecutive rate hikes, worsening affordability, and an easing in the South East Queensland migration trend have weakened demand.
Regional Queensland recorded a larger quarterly decline in unit values (-2.9%) thanks to a stronger decline across the Gold and Sunshine Coasts (down -2.9% and -6.0%, respectively).
At the other end of the scale, Regional Tasmania units recorded the strongest decline in unit values, with the quarterly growth rate remaining steady at -7.8% for the second consecutive month.
This was followed by units across Hobart (-4.2%) and Sydney (-3.3%), which both recorded a deceleration in the quarterly rate of decline, down from -5.3% and -3.9%, respectively, over the three months to September.
National unit rental index remained steady
The monthly change in CoreLogic's national unit rental index remained steady, rising 1.1% for the third consecutive month.
While the pace of quarterly rental growth has eased slightly from 3.7% over the July quarter to 3.3% over the three months to October, national unit rents are still increasing at twice the rate of house rents (1.6%).
With the exception of Regional SA and Hobart, each capital city and the regional area saw unit rents rise at a faster pace than their lower-density counterpart.
With a median weekly rental value of $510, national unit rents continue to be approximately $50 per week cheaper compared to national house rents at $561.
However, with the rate of growth in unit rents outperforming that of houses over the past year, the gap between house and unit rents has narrowed by around $10.
As the affordability benefit that unit rents offer diminishes, it's possible we could see some rental demand shift back in favour of the lower-density sector.
Across the individual capital city unit markets, the quarterly pace of rental growth across the capitals has continued to trend downwards.
The exception was Sydney, which recorded a new cyclical peak of 4.3% over8.89%the three months to October, thanks to the strong return of overseas migration.
Brisbane also recorded a 4.3% quarterly rise in rental values, down from 4.6% over the three months to September, while Darwin, Adelaide and Melbourne saw unit rents rise by 3.5%, 3.3% and 3.1%, respectively.
Hobart (0.5%) and Canberra (0.2%) recorded milder rental growth, due partially to the stronger growth trends seen over the beginning of COVID.
National gross rental yields for units rose a further nine basis points in October
National gross rental yields for units rose a further nine basis points in October to 4.24%, taking yields 58 basis points above the record lows recorded in December 2021 (3.66%).
The strong yield recovery has seen each capital unit's yields rise above the levels recorded this time last year, with the exception of Adelaide and Canberra, where yields are still down eight and six basis points, respectively.
A few tailwinds are starting to emerge
While it is likely values across Australia's unit market will continue to decline over the coming months, a few tailwinds are starting to
emerge.
The de-deceleration in the quarterly growth trend could be an indication that we have moved passed the worst value declines.
However, it's still early days, and any change to the outlook for interest rates could see declines accelerate once more.
Additionally, Australia's labour market remains extremely tight, with the unemployment rate falling to 3.4% in October.
Coupled with the strong wage growth seen over the September quarter, this should help keep a lid on distressed or forced sales.
On the flip side, the November rate rise (25 basis points) took the cumulative increase in the cash rate 275 basis points higher than the record lows seen over COVID (0.10%).
or those who purchased before October 2021, interest rates have now risen by more than the 2.5% serviceability buffer they were assessed under, while those who purchased after October 2021 will soon reach their serviceability buffer (3.0%).
Arguably, household budgets have already been stretched by persistently high non-discretionary inflation, and many may find it hard to accommodate higher mortgage repayments.
As more borrowers move into uncharted territory, we could see an increasing number of households find it harder to service their loans.
- *E-mail:
- *Cel:
- *Password:


